With the Winter quarter wrapping up and Spring break around the corner, I can take time to reflect on how I’ve progressed with GIS since first picking it up last Spring. For my final project, I opted to revisit the beautiful city of Denver, Colorado. I’ve already completed projects for two separate classes on the city by sheer happenstance. So I decided to have a go again, because I am nothing if not consistent. As someone who enjoys commuting by bicycle but is still aware of the risks, I wanted to explore the viability of cycling as a commute option in Denver.
I sourced bike infrastructure data from the Denver Open Data Catalog, population and income data from NHGIS, and historic redlining maps courtesy of Mapping Inequality. With it, I created several maps of current and planned cycling infrastructure overlaid with neighborhood income to help determine whether the distribution of cycling infrastructure is appropriate, equitable, and improves the viability of active travel for historically underserved communities in Denver.
Throughout this quarter, I was introduced to many new analysis techniques, and while I wanted to use all of them, I was restricted by the timeframe of the assignment and the applicability of the various methods. Turns out, the Summarize Within tool in ArcGIS Pro is incredibly useful because presenting the data is half the battle. To aid with presenting the data, I took advantage of the Density-Based Clustering tool to distinguish clusters of traffic-calming installments in Denver and emphasize any visual relationship between it and historic redlining data. 1
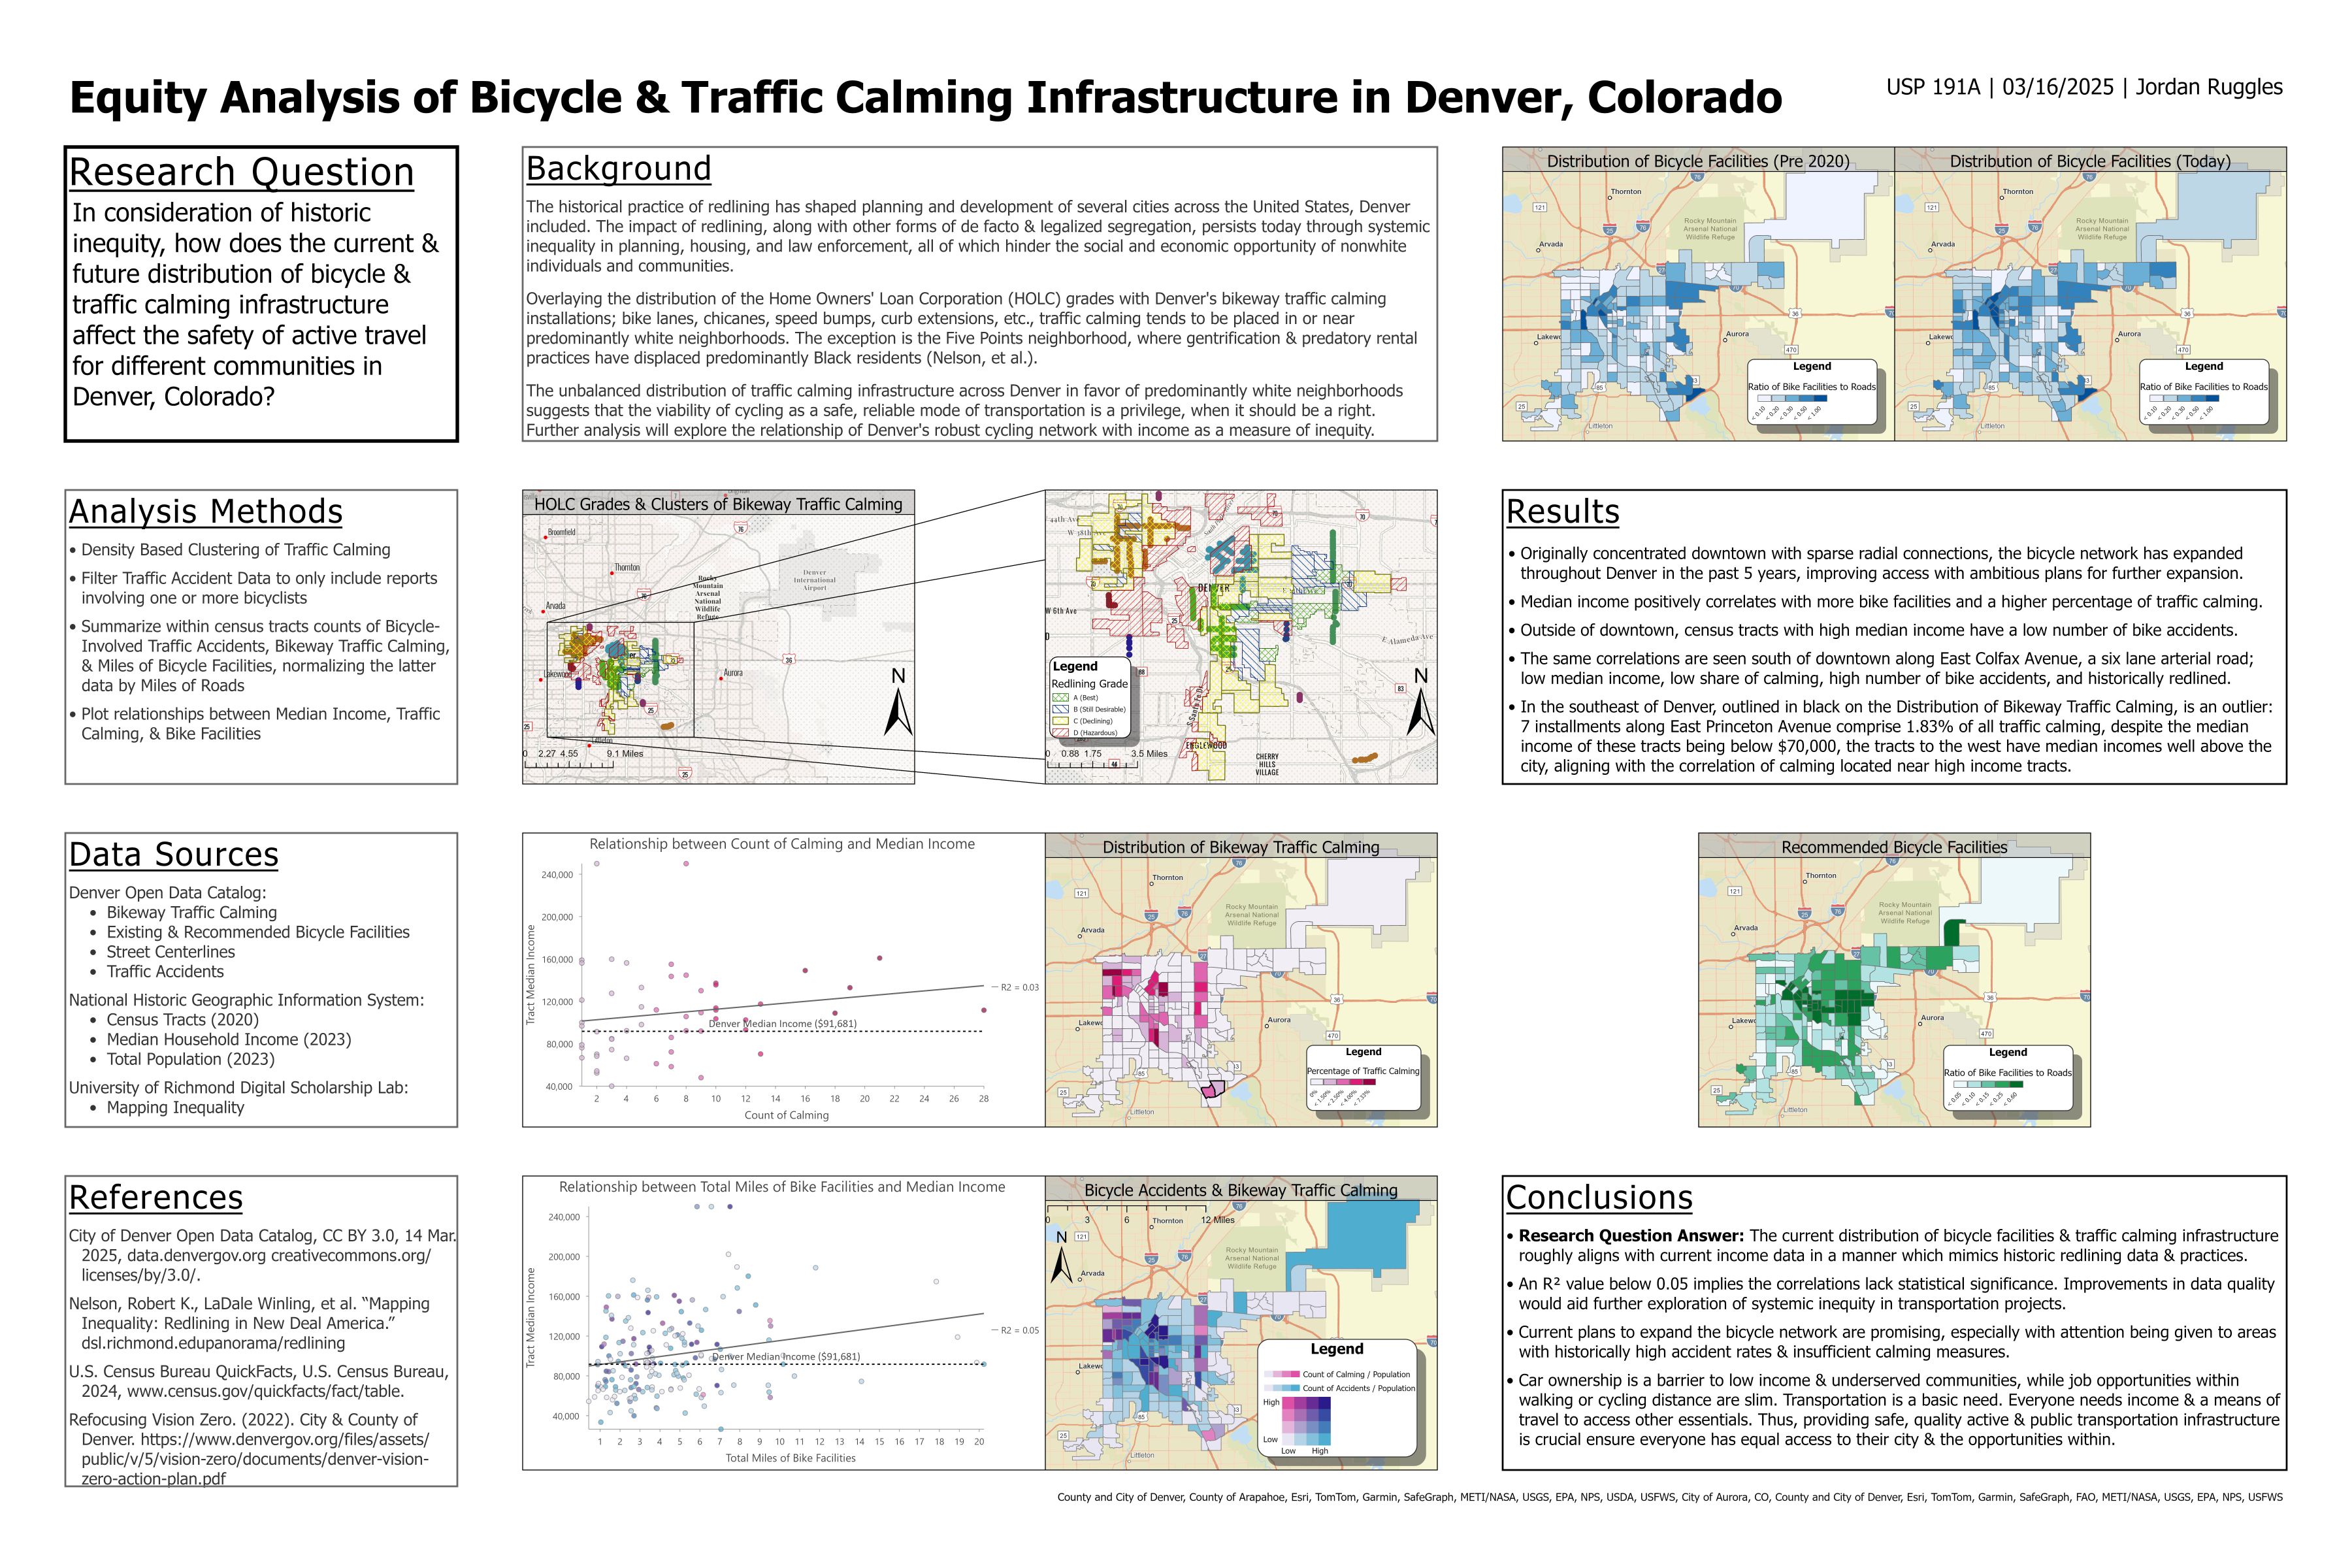
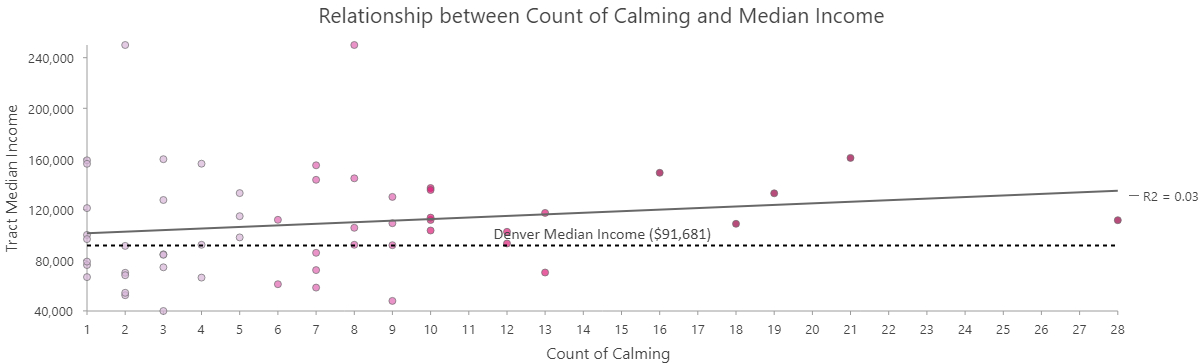
But a simple visual relationship is nothing more than speculation. Turning to the remaining maps of the present day and the associated charts, it’s apparent that traffic-calming exists predominantly in wealthier neighborhoods, those above Denver’s median income of $91,681.
Similarly, there’s an observed mismatch where neighborhoods with a high number of accidents over 10 years lack necessary traffic-calming, while neighborhoods with a high number of traffic-calming installments have relatively fewer accidents over the same 10-year period. This correlation extends further with the low accident neighborhoods also having a high median income.
Overall, the association of bike and traffic-calming infrastructure in Denver with income data suggests an inequitable distribution. However, I can not conclude any statistical significance given the noisy data and lack of detail in the data to properly analyze safety and equity. The plans to expand the bicycle network are promising in their scope, and I am hopeful that Denver and other cities continue collecting data and conducting research to permit improved equity analysis in their development plans. While some bike infrastructure is better than none at all, when government budgets are almost always strapped for cash, it’s important to establish the needs of different communities to ensure resources are best utilized.
Car ownership is a barrier to low income and underserved communities, while job opportunities within walking or cycling distance are slim. Transportation is a basic need. Everyone needs income and a means of travel to access other essentials. Thus, providing safe, quality active and public transportation infrastructure is crucial ensure everyone has equal access to their city and the opportunities within.
Working on this project, I’m satisfied with what I was able to research, plan, and deliver in a short two-week timeframe. It is in no ways perfect, but I consider the analysis, and especially the presentation of my findings to be a vast improvement compared to when I started last Spring. I want to continue improving my skills in GIS next quarter in the final course of this sequence and I would jump at the opportunity to revisit this or a similar topic in more depth.
-
For more information on traffic-calming and different calming measures, I recommend these fact sheets from the Institute of Transportation Engineers. ↩