I will preface this post with the fact that this is my first GIS project, a midterm with about a month of guided experience with the software. This post is less of a proud display of my skills, and more of a benchmark of progress, demonstrating how quickly I could pick up the skills needed to create the maps below and serving as a reference for future projects to create a comprehensive walkthrough of my growth and experience with GIS and urban planning.
With that disclaimer, let’s move on to the project itself: an analysis of redlining, with maps courtesy of Mapping Inequality, as a historic inequity and its impact on today’s communities through different government data sources. This early in the quarter, we were provided a curated list of data sources to use, as opposed to having to scour the internet for usable, trustworthy, unbiased sources. I came into this class with a vague desire to practice with transportation data, so I tried my best to approximate analyzing transportation-related metrics through my chosen data sources; air pollution data from the Environmental Protection Agency (EPA), commuter data from NHGIS, and the generational commuting data from the Opportunity Atlas.
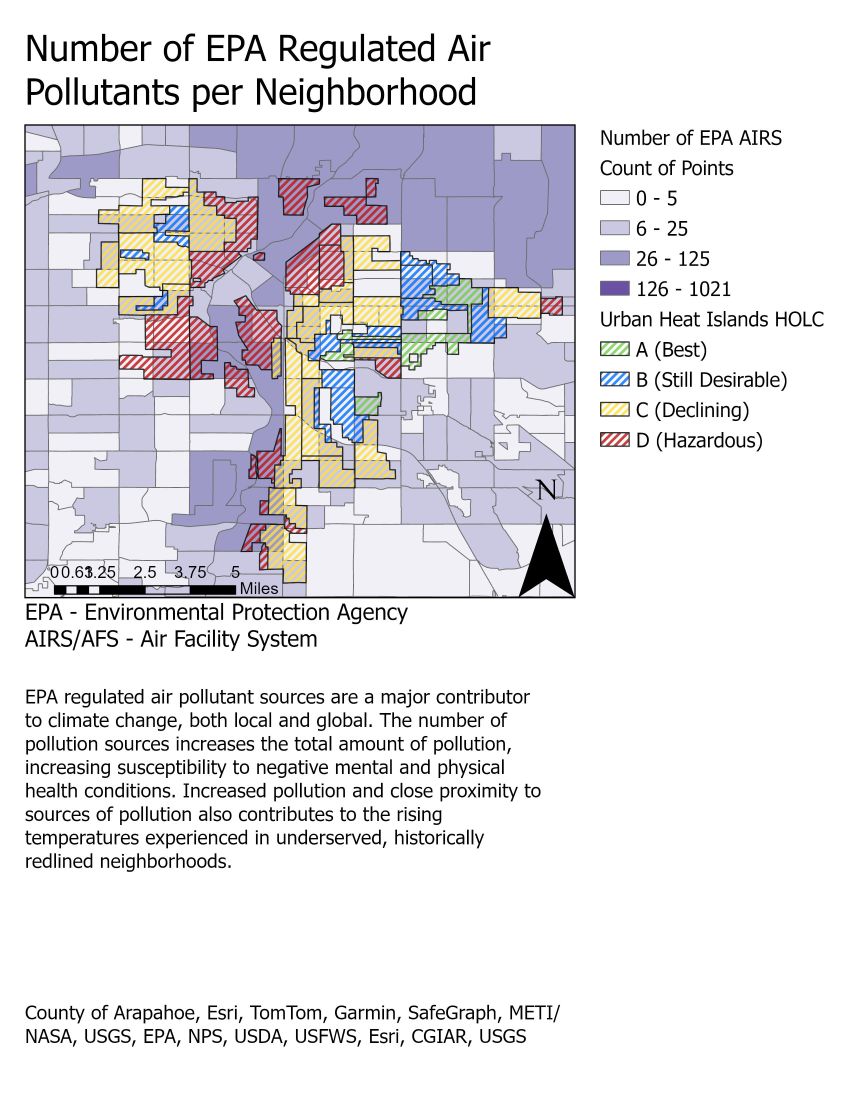
The first map overlays historical redlining grades, mistakenly labeled as Urban Heat Islands, with a logarithmic count of EPA regulated air pollutants. A visual correlation is immediately apparent, with redlined neighborhoods, especially those adjacent to I-25, being the areas with the highest air pollution. Increased exposure to air pollutants locally increases residents’ risk of mental and physical ailments, among other adverse effects, serving as an example of how the practice of redlining has shaped our cities and continues to disproportionately harm underserved and minority communities.
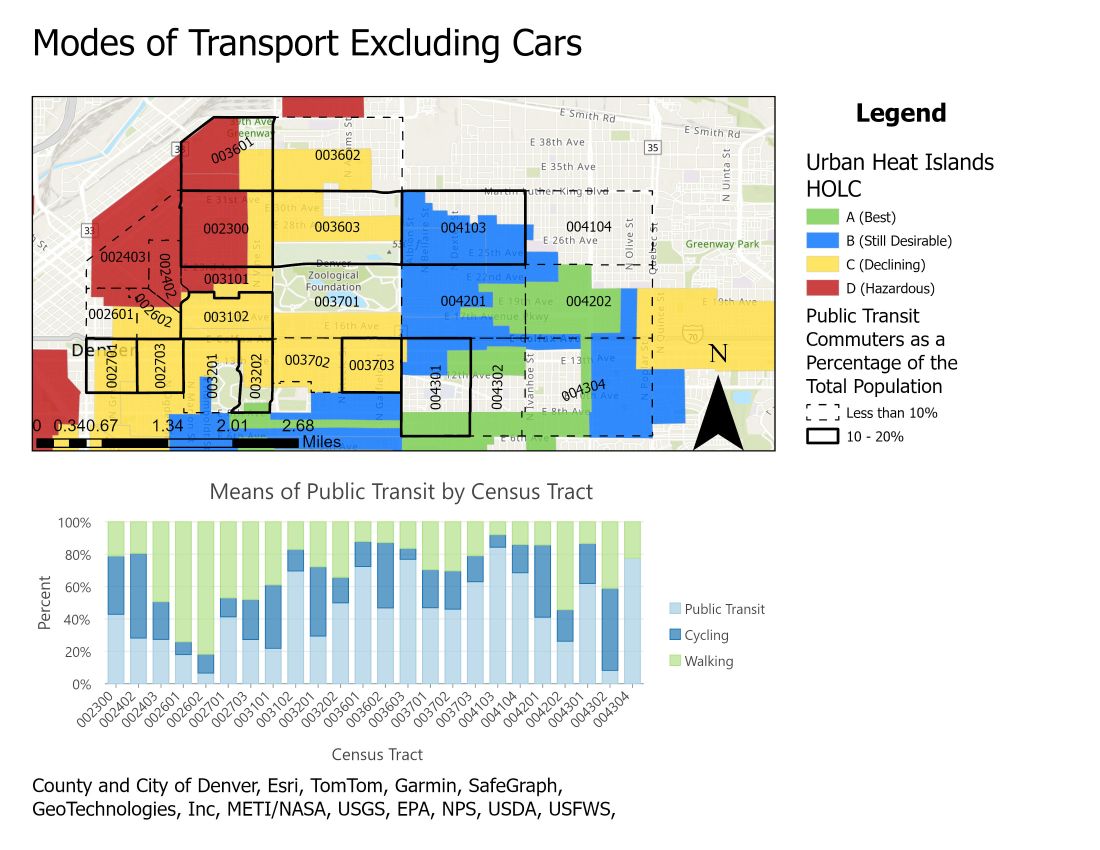
Zooming in near City Park, the next two maps assess the effects of redlining on commuting patterns, looking at neighborhoods across all residential grades. The first map seeks to observe the level of car dependency across neighborhoods, with the map itself overlaying the percentage of the population that commutes via alternative modes of transportation, labeled as public transit because I lacked a better descriptor at the time, while the graph represents the share of those alternative modes; cycling, walking, and bus (also labeled as public transit). From the graph, it’s apparent that walking represents a large share of alternative modes of transportation in the western census tracts, those closer to downtown and historically redlined, while transit is a more popular travel mode in the eastern tracts. Several factors could be at play to produce such trends, from the west being a more walkable region than the east which would encourage more people to walk, to the east having a greater abundance of reliable public transit, encouraging more people to use it rather than walk. What also appears striking is the lack of a bias between the percentage of commuters who travel via alternative modes of transportation, suggesting the region is relatively homogenous today, despite the inequity and injustice the west may have faced due to redlining.
A similar, though not as stark, divide can be seen in the graph related to the second map, with fewer people working in the historically redlined tracts working in their childhood commuting zone, while significantly more remained in the eastern tracts. The differences in how commuting patterns have changed can not be easily explained from the map alone, so it’s important to consider what the data can’t tell us through context, the history of gentrification in Denver. The redlined neighborhood on the map is the Five Points neighborhood, the historic seat of Denver’s Black community. But with a desirable proximity to downtown, residents fell victim to predatory rent and eviction practices, resulting in the displacement of many Black residents and giving way for the neighborhood to be gentrified into what it is today. 1 Taken together, the lower number of people working in their same childhood commuting zone in the west could be due to the displacement caused by gentrification, while the east remains high in the absence of gentrification. So, while there is a lack of a significant correlation between historic redlining data and commuting patterns, it does not outright dismiss the impact of history on the present. Instead, it prompts a deeper investigation into how communities have evolved over time, either as a result of or in spite of injustice, and forces us to grapple with how we continue to shape our communities to benefit and include everyone.

Overall, this project was much more of a learning experience than a showcase of skills. If anything, it was a showcase of how much I still have to learn about GIS and designing layouts to effectively communicate ideas and their significance through data. The consistent challenge across the whole project was the readability of the maps. With each map, I attempted to display two or three different data sets, each represented through polygons and colors. With the redlining data already using 4 distinct colors, it was difficult to find a color pattern for the EPA data that would not be obscured, leaving purple as the natural choice. Still, there was the issue of displaying two or more colors in one region, leading to me spending a significant portion of time modifying the symbology to reach the end result of a hatched fill, showing enough of the colors on the redlining map while allowing the summaries of the EPA data to show through.
The same challenge arose on the commuting maps, but with the additional wrinkle of having to connect census tract numbers on the graph to their corresponding location on the map. The result is, in my opinion, less than desirable since the map now becomes noisy and overcrowded with the base map, symbology, census tract outlines, census tract numbers, and map scales all competing for attention in the same limited space. The same chaotic energy is carried into the map legends, with inaccurate labels being a major oversight, but also the lack of conciseness in the titles of the labels and graphs, making it incredibly difficult to decipher the purpose of the map as a whole, speaking as the person who made these maps. Given the opportunity to redo these maps, I would first want to rename everything to be immediately understandable to anyone, followed by splitting the maps, removing the redlining grades as an overlay to help say more with less. This project was very much rough around the edges, but I believe it’s important to stress that we all have to start somewhere, and this is where I started with GIS. Nobody’s perfect and although practice supposedly makes perfect, I say practice makes improvement motivated by perfection.